What Is Data Analytics?
Data analytics is the process of collecting, cleaning, and examining raw data to identify patterns, draw conclusions, and support better decision-making. It sits at the intersection of statistics, technology, and business understanding — and it has become one of the most in-demand professional skills as organisations recognise how much value is locked inside the data they already collect.
If you have never worked with data professionally before, the field can seem technical and inaccessible. In practice, a significant proportion of analytical work at entry level involves tools most people have already encountered — spreadsheets, charts, and structured queries — combined with a way of thinking about problems that can be learned fairly quickly.
Key fact: U.S. data scientist roles are projected to grow 34% between 2024 and 2034, according to Bureau of Labor Statistics projections. India saw a 70% increase in data analyst job openings over a five-year period. Demand significantly outpaces the current supply of qualified professionals.
The Data Analytics Process
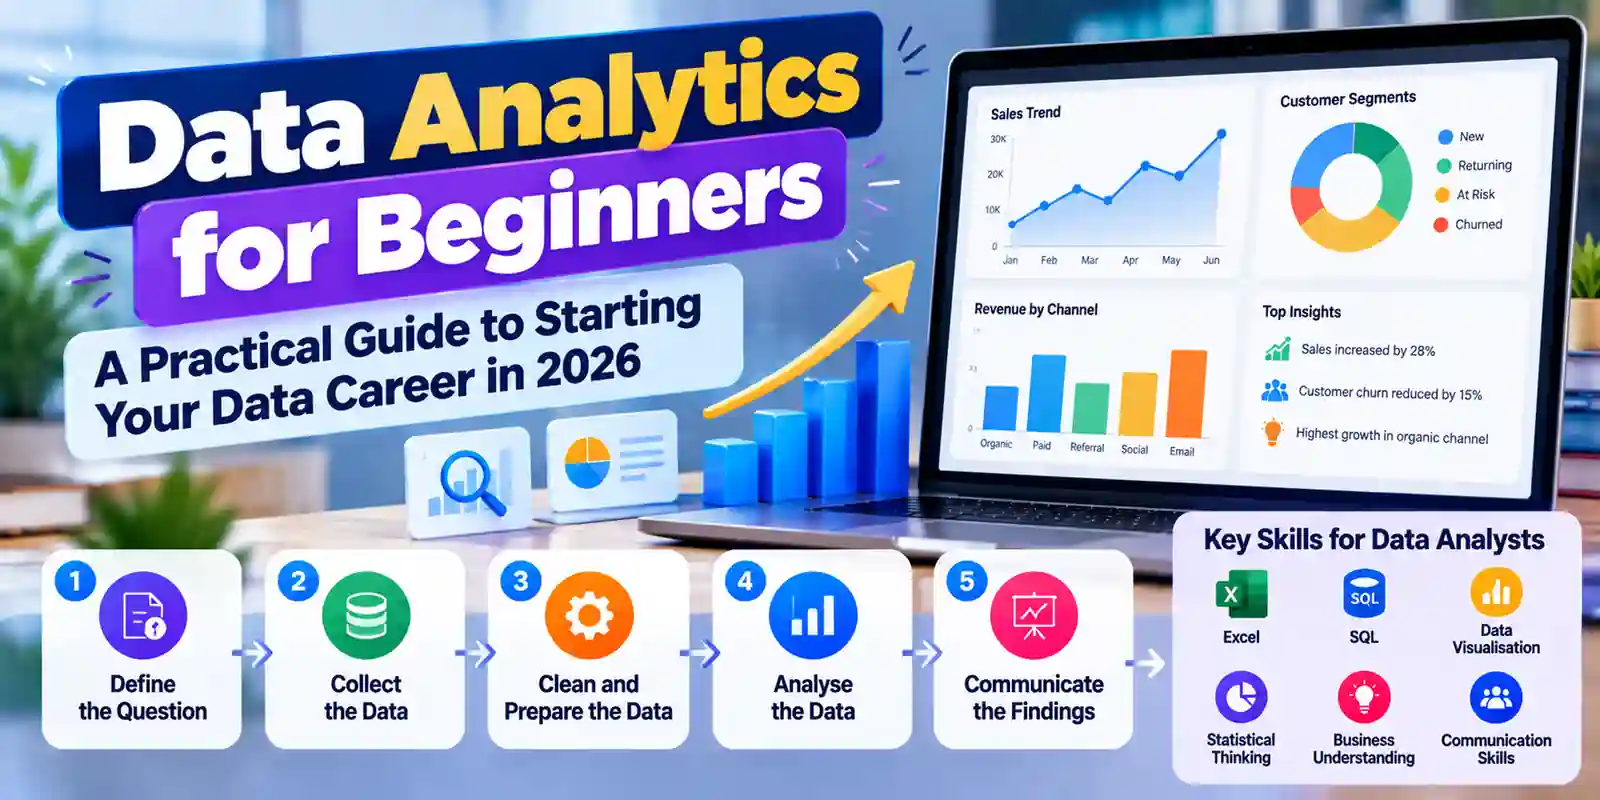
Understanding data analytics begins with understanding the sequence of steps that transform raw information into a useful insight. Most analytical projects follow a consistent workflow:
1. Define the Question
Every useful analysis starts with a clear question. "What is causing our customer churn rate to increase?" is an actionable analytical question. "What does our data look like?" is not. The quality of the question determines the usefulness of the answer, which is why analytical thinking — asking the right question — is as important as technical skill.
2. Collect the Data
Data comes from many sources: transaction systems, web analytics, CRM platforms, survey tools, sensors, or publicly available datasets. Knowing where to find relevant data and how to extract it — usually through database queries or API calls — is a foundational practical skill.
3. Clean and Prepare the Data
Raw data is almost never analysis-ready. Missing values, inconsistent formatting, duplicate records, and outliers all need to be addressed before meaningful analysis is possible. Data cleaning is often described as the most time-consuming step in analytics work — experienced analysts typically allocate 60-80% of project time to preparation rather than the analysis itself.
4. Analyse
With clean data, you can apply statistical methods, build visualisations, and identify patterns. At entry level, this often involves pivot tables, summary statistics, and trend lines. At more advanced levels, it includes statistical modelling, machine learning, and predictive analysis.
5. Communicate the Findings
Analysis that cannot be communicated clearly has limited value. Translating quantitative findings into clear charts, narratives, and recommendations for non-technical audiences is a distinct skill — and one that distinguishes effective analysts from technically proficient ones.
Core Skills Every Data Analyst Needs
Statistical Thinking
You do not need a statistics degree, but you do need to understand core concepts: averages and distributions, correlation versus causation, sample sizes and confidence, and how to identify whether a pattern in data is meaningful or the result of random variation. These concepts inform how you ask questions and how you interpret answers.
Excel and Spreadsheet Skills
Excel remains the most widely used analytics tool in business environments. Pivot tables, VLOOKUP/XLOOKUP, conditional formatting, data validation, and charting are used daily in analysis roles across most industries. Proficiency here is a baseline expectation at entry level.
SQL
Most organisational data lives in relational databases. SQL (Structured Query Language) is the standard language for querying that data — filtering records, joining tables, aggregating results, and extracting exactly the dataset an analysis needs. Learning SQL is one of the highest-return-on-investment investments a beginner data professional can make, because it applies across virtually every industry and database system.
Data Visualisation
Humans process visual information far more efficiently than raw numbers. The ability to choose the right chart type for a given insight — a bar chart for comparing categories, a line chart for trends over time, a scatter plot for relationships between variables — and to design visualisations that communicate clearly rather than confuse is a core professional skill.
Python (as you progress)
Python is the dominant programming language in data analytics and data science. For beginners, it is not an immediate requirement, but learning its core libraries — pandas for data manipulation, matplotlib and seaborn for visualisation, and eventually scikit-learn for machine learning — opens analytical capabilities that spreadsheet tools cannot match.
Key Data Analytics Tools
ToolPrimary UseBest ForExcelSpreadsheet analysis, pivot tables, basic visualisationStarting out; business reportingSQLQuerying and manipulating data from databasesAnyone working with structured data setsPythonData manipulation, statistical analysis, machine learningAdvanced analysis and automationPower BIInteractive dashboards and business intelligence reportsBusiness users and stakeholder reportingTableauData visualisation and exploratory analysisVisual storytelling with dataWhere to Start as a Complete Beginner
The common mistake beginners make is trying to learn everything at once. Data analytics encompasses statistics, programming, domain knowledge, and communication skills — no one acquires all of these simultaneously. A more productive approach is to build in sequence:
- Start with Excel — build genuine spreadsheet proficiency before adding other tools
- Learn SQL — even basic querying skills open up most entry-level analytics roles
- Pick a visualisation tool — Power BI if you work in a Microsoft environment; Tableau if your organisation uses it already
- Develop a portfolio — work through a public dataset and document your analysis and conclusions
- Add Python when you are ready for more complex analysis or automation
The sequence matters less than the habit of practice. Working with real data — even public datasets on Kaggle or data.gov — builds intuition that no amount of theoretical reading can replicate.
Career Opportunities in Data Analytics
Data analytics skills are in demand across sectors including finance, healthcare, retail, logistics, marketing, and technology. The range of roles is broader than most beginners expect:
- Data Analyst — the core role: cleaning, analysing, and presenting data to inform decisions
- Business Intelligence Analyst — focused on dashboards, reports, and operational metrics
- Marketing Analyst — applying analytics to campaign performance, customer segmentation, and channel optimisation
- Financial Analyst — using data to model financial performance and support investment decisions
- Analytics Manager — leading teams, defining analytical strategy, and translating business questions into analytical projects
Salary Expectations
RoleSalary Range (US)Salary Range (India)Junior Data Analyst$43,000 – $65,000 per year3 – 5 LPAMid-Level Data Analyst$65,000 – $90,000 per year7.5 – 10 LPASenior Data Analyst$90,000 – $130,000 per year15+ LPAAnalytics Manager$70,000 – $139,000 per year18 – 30+ LPASalary figures are approximate and vary by location, industry, organisation size, and specific skill set. Always verify current market rates through job boards and professional salary surveys in your target market.
Data Analytics vs Data Science
These terms are sometimes used interchangeably but refer to different things. Data analytics focuses on examining existing data to answer specific business questions — what happened, why it happened, and what should happen next. Data science is broader and more technically intensive, involving the construction of predictive models, machine learning systems, and novel analytical methods.
For most professionals entering the field, data analytics is the appropriate starting point. Data science roles typically require stronger programming and mathematics backgrounds, and are more specialised. Many data scientists began their careers as analysts.
Frequently Asked Questions
Do I need a degree to start a career in data analytics?
No — many data analysts enter the field from non-technical backgrounds including marketing, finance, operations, and business. What matters most to employers is demonstrated skill: a portfolio of analyses, proficiency in SQL and a visualisation tool, and the ability to communicate findings clearly. Degrees in maths, statistics, computer science, or related fields are helpful but not universally required.
How long does it take to learn data analytics?
Foundational skills — Excel, basic SQL, and a charting tool — can be acquired in two to four months of consistent part-time study. Reaching professional-level competency across a broader toolkit, including Python and more advanced statistical methods, typically takes six to twelve months. The range depends significantly on how much time you invest and how much hands-on practice you do with real data.
What is the difference between data analytics and business analytics?
Data analytics focuses on collecting and interpreting data to identify patterns and answer specific questions. Business analytics is more closely tied to strategic decision-making — applying those insights to drive growth, solve operational problems, and guide company strategy. In practice, the skills overlap significantly, and many roles involve both.
Which industries hire data analysts?
Finance, healthcare, retail, e-commerce, technology, marketing, logistics, and consulting all have substantial demand for data analysts. Almost any industry that collects significant volumes of customer, operational, or financial data has analytical roles.
What is the best programming language for data analytics?
Python is the most widely used programming language in data analytics and data science, and the most versatile for long-term career development. SQL is the most immediately practical for accessing and querying organisational data. For beginners, SQL is the higher priority — Python can follow once the analytical fundamentals are established.
Is data analytics a good career in 2026?
Yes, demand continues to outpace supply of qualified professionals, salaries are competitive relative to comparable roles, and the skills transfer across industries, providing career flexibility. The integration of AI tools into analytical workflows is changing some aspects of the role, but the core need to turn data into decisions is, if anything, increasing.
Get a free marketing audit
See exactly where your SEO, ads and website are leaving money on the table.