
What Is Churn Analysis?
Churn analysis is the process of examining customer data to understand why people stop doing business with a company and at what rate departures occur. Rather than simply tracking lost accounts, it involves identifying the behavioural signals, demographic patterns, and operational failures that precede a customer's exit — giving businesses the intelligence they need to intervene before that exit happens.
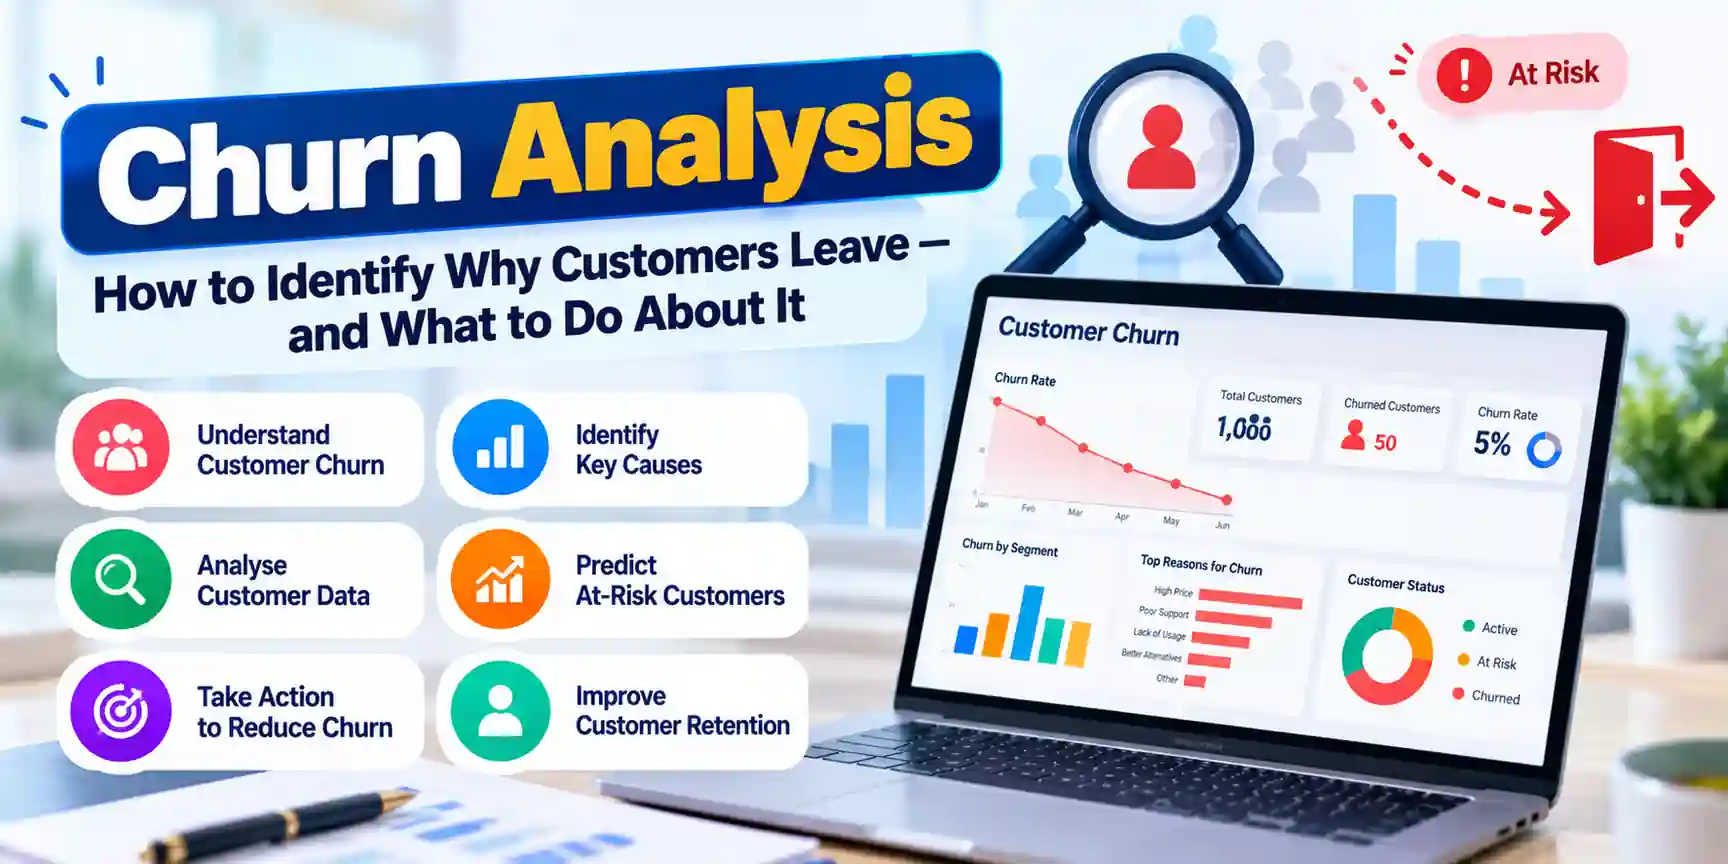
The term "churn" refers to the proportion of customers lost within a defined period. A business with 1,000 customers at the start of a month and 950 at the end has a churn rate of 5%. While that figure tells you how many left, churn analysis explains why — and that distinction is what makes it actionable.
Quick answer: Churn analysis evaluates the rate at which customers leave a business and identifies the underlying reasons. It combines data analysis, customer feedback, and predictive modelling to support retention strategy.
Why Churn Analysis Matters
Acquiring a new customer costs significantly more than retaining an existing one — estimates from various sources place the ratio anywhere between five and seven times higher. That economic reality means even a modest improvement in retention has a disproportionate impact on profitability. But the financial case is only part of the story.
Customers who leave rarely announce their reasons unprompted. Churn analysis creates a systematic method for uncovering those reasons from the data that already exists: purchase histories, support interactions, product usage logs, and survey responses. Without this analysis, businesses are left guessing — and guessing tends to produce generic loyalty programmes that address the wrong problems.
Key Business Benefits
- Improved customer lifetime value through targeted retention investments
- Earlier identification of product or service weaknesses before they affect revenue
- More precise marketing spend directed at the customers most likely to leave
- Stronger competitive positioning based on genuine insight rather than assumption
- Reduced pressure on customer acquisition budgets
Types of Churn
Voluntary Churn
Voluntary churn occurs when a customer actively chooses to leave. They may have found a better alternative, become dissatisfied with pricing, or simply no longer need what you offer. This type is the most directly addressable through retention programmes because it reflects a conscious decision that can, in many cases, be reversed or delayed.
Involuntary Churn
Involuntary churn happens when a customer exits due to circumstances outside their deliberate intention — a failed payment, an expired credit card, a service interruption, or an address change that disrupts delivery. These departures are often preventable through operational improvements: automated payment retry systems, billing reminders, and proactive account maintenance can recover a significant portion of involuntary churn.
Predictive Churn Analysis
Predictive churn analysis uses historical customer data and machine learning models to identify customers who show patterns similar to those who previously left. Rather than reacting after departure, businesses can flag at-risk customers and intervene proactively — with a targeted offer, a support outreach, or an account review — before the relationship ends.
Segmentation-Based Analysis
This approach divides customers into groups by demographics, behaviour, or value and examines churn rates within each segment. A subscription software business might find that customers on monthly plans churn at three times the rate of annual subscribers, or that a particular industry vertical shows consistently lower retention. Segment-level analysis makes retention strategy significantly more precise.
The Most Common Causes of Customer Churn
Understanding the causes of churn is as important as measuring its rate. The most frequently documented triggers fall into several categories:
- Poor customer experience — slow support responses, confusing interfaces, or unresolved complaints
- Pricing sensitivity — cost increases that outpace perceived value
- Unmet expectations — a gap between what was promised during acquisition and what was delivered
- Lack of engagement — customers who rarely use a product are significantly more likely to cancel
- Competitive alternatives — a rival offers a better price, feature set, or service model
- Life events and changing needs — relocation, budget changes, or shifts in organisational priorities that remove the need for your product
- Overaggressive marketing — excessive promotional contact that drives customers away rather than re-engaging them
Most churn involves a combination of these factors rather than a single cause. A customer already unhappy with pricing becomes far more likely to leave after a single negative support experience.
Churn Detection Techniques
Behavioural Data Analysis
Usage data is one of the most reliable early indicators of impending churn. Customers who reduce login frequency, stop using core features, or shrink their order volumes are showing clear signals. Tracking engagement metrics over time — not just revenue — gives retention teams an earlier warning window than transaction data alone.
Customer Feedback and Sentiment Analysis
Support tickets, survey responses, and online reviews provide qualitative insight that quantitative data cannot. Natural language processing tools can analyse large volumes of customer communications to identify recurring themes — a spike in complaints about a specific feature, for example, may precede a measurable increase in churn weeks later.
Machine Learning Predictive Models
More sophisticated churn programmes use supervised machine learning models trained on historical customer data. These models learn to identify combinations of signals — reduced usage, recent support contacts, pricing tier, tenure, and dozens of other variables — that together predict a high probability of departure. Common approaches include logistic regression, random forest classifiers, and gradient boosting models.
Key Churn Metrics
MetricWhat It MeasuresWhy It MattersChurn RatePercentage of customers lost in a given periodCore health indicator of retention performanceCustomer Lifetime Value (CLV)Total revenue expected from a customer over their relationshipPrioritises high-value retention effortsNet Promoter Score (NPS)Customer satisfaction and referral likelihoodEarly warning signal for potential voluntary churnCustomer Retention RatePercentage of customers retained over a periodInverse of churn rate — measures programme success
Strategies to Reduce Churn
Onboarding Improvements
A significant proportion of churn occurs early in the customer relationship. Customers who do not reach their first meaningful outcome with a product quickly become candidates for cancellation. Improving the onboarding process — with better tutorials, check-in communications, and milestone tracking — directly reduces early-stage churn.
Personalised Retention Campaigns
Blanket discounts sent to all customers are expensive and often unnecessary. Personalised campaigns targeted specifically at at-risk customers — identified through predictive modelling — offer the same or better results at lower cost. A customer flagged as high-churn risk who has not used the product in 30 days needs a different message than one who is active but complaining about pricing.
Proactive Customer Success Programmes
Enterprise and B2B organisations typically assign dedicated customer success managers to high-value accounts. Their role is not reactive support but proactive engagement: regular check-ins, usage reviews, and ensuring customers are extracting full value. This relationship-based approach is one of the most effective retention tools available, though it does not scale cost-effectively to every account tier.
Win-Back Campaigns
Not all churned customers are permanently lost. Customers who left due to price sensitivity may return when a promotional offer lands at the right moment. Those who left due to a product gap may re-engage after that gap is addressed. Win-back campaigns targeting recently churned customers with specific, relevant messaging can recover a portion of lost revenue that would otherwise remain permanently gone.
Tools for Churn Analysis
- CRM platforms such as Salesforce and HubSpot — centralise customer data and track interaction history
- Business intelligence tools such as Tableau and Power BI — visualise churn trends across segments
- Predictive analytics platforms such as IBM Watson Analytics and RapidMiner — build and deploy churn prediction models
- Customer data platforms — unify data from multiple sources into a single customer profile for more accurate analysis
- Survey tools and NPS tracking software — capture qualitative signals alongside behavioural data
Frequently Asked Questions
How is churn rate calculated?
Churn rate is calculated by dividing the number of customers lost during a period by the number of customers at the start of that period, then multiplying by 100 to express it as a percentage. For example, losing 50 customers from a base of 1,000 gives a churn rate of 5%.
How often should churn analysis be performed?
Most businesses benefit from monthly or quarterly churn analysis at a minimum. High-volume subscription businesses or those experiencing elevated departure rates may track churn weekly. The frequency should match the pace at which retention decisions need to be made.
What is a good churn rate?
Benchmarks vary significantly by industry. SaaS businesses typically target annual churn rates below 5-7%. Subscription consumer services operate with higher tolerance. Rather than comparing against a universal benchmark, the more useful goal is consistent improvement on your own baseline over time.
What is the difference between voluntary and involuntary churn?
Voluntary churn is a deliberate customer decision to leave — driven by dissatisfaction, cost, or a competitive alternative. Involuntary churn occurs without deliberate intent, usually due to payment failures or logistical disruptions. Both require different interventions: retention programmes address voluntary churn; operational fixes address involuntary churn.
Can machine learning predict churn accurately?
Yes, predictive models can achieve meaningful accuracy when trained on sufficient historical data. However, their value depends on data quality, model maintenance, and the organisation's ability to act on predictions quickly enough. A model that identifies at-risk customers two days before cancellation is far less useful than one that flags them two weeks out.
Which industries have the highest churn rates?
Telecommunications, financial services, and subscription streaming services typically report the highest churn rates, partly because switching costs are low and competition is intense. Professional services and B2B software often see lower churn, particularly where contracts create switching friction.
Get a free marketing audit
See exactly where your SEO, ads and website are leaving money on the table.